
Overrated vs Underrated Football Teams: The Metrics That Actually Matter
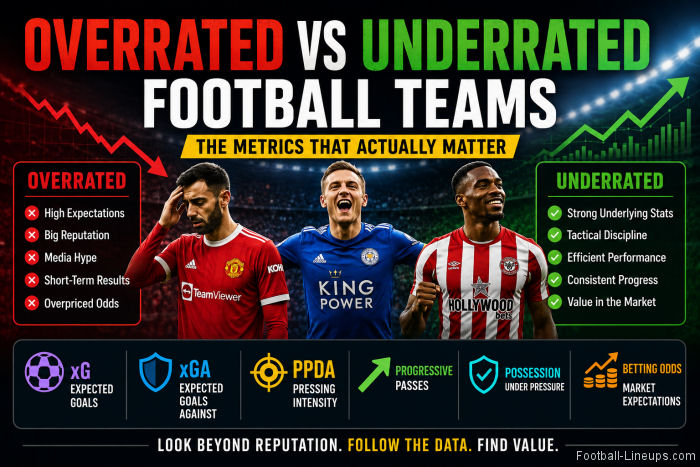
Football fans often debate whether a club is overrated or underrated, but league tables alone rarely tell the full story. Modern football analytics offer deeper insights into team performance by measuring chance quality, defensive pressure, ball progression, and market expectations. Understanding metrics such as expected goals (xG), PPDA, and possession under pressure can help supporters identify teams whose reputations differ from their actual performances.
Why Public Opinion Gets Football Teams So Wrong
Media narratives and legacy biases can make strong teams seem weak or vice versa. Fans and pundits often judge clubs by recent headlines, a famous name, big transfers, or trophy history, rather than by underlying performance. For example, many still saw Manchester United as a perennial powerhouse after 2013, despite lackluster results. This illustrates recency bias, where people place excessive weight on the last few games or seasons. A team on a short winning streak suddenly looks “back on track," even if the new wins were against weak opponents. Conversely, a few losses can unjustly brand a team as underperforming. Media hype amplifies this effect. Flashy signings or a cup run grab headlines, yet they may not reflect sustainable strength. It’s common for under-the-radar clubs (especially those with few trophies or smaller budgets) to be labeled “underdogs” even when metrics say otherwise. As a result, popularity and past fame can make public perception diverge from reality. Judging a season by its last three games can be misleading. Leicester City’s title-winning 2015–16 season famously began with 5000:1 odds. Few observers expected that run, yet by year’s end their stats (especially finishing) were off the charts. This section sets the stage: team reputations often lag behind what the data reveals, setting up the need for analytic metrics.The Metrics That Cut Through the Hype
Advanced stats expose a team’s true performance in ways league tables don’t. For instance, xG (expected goals) and xGA (expected goals against) assign a probability to every shot based on its quality. Summing shot probabilities gives a team’s xG. Comparing that figure with actual goals helps identify finishing efficiency or luck. Brentford in 2021–22 had ~49.5 xG and 50.9 xGA – nearly matching their 48 goals for and 56 against – revealing that they weren’t flukily far off from league-average attack and defense. Underrated teams often outperform their xG (meaning they score more than expected), while overrated teams might underperform it. PPDA (passes per defensive action) measures pressing intensity. It is calculated by dividing how many passes an opponent completes by the number of defensive actions (tackles, interceptions, etc.) a team makes in the attacking two-thirds.A low PPDA means heavy pressing. Opponents complete few passes before a defensive action occurs. Top pressing teams like Barcelona (PPDA ≈ 7.3 in 2021–22) or Morocco (around 7.1 at WC 2022) keep opponents unsettled. Progressive passes count how often a team moves the ball significantly toward goal (by at least 10 yards or into the box). This tracks creative buildup that simple possession or pass counts miss. The final metric is possession under pressure, which gauges how well a team keeps the ball when opponents press. (Data providers like SofaScore track what percentage of passes are made when a defender is nearby.) A high value indicates calm under duress. Tables only show points and goal differential, but these five stats reveal how teams create and suppress chances. Brentford’s 49.5 xG versus 48 goals provides an example of a team whose chance creation closely matched its actual output. Using sources like FBRef and Understat, analysts can read a team’s “true” attack/defense quality beyond the hype and traditional football lineup analysis.
| Metric | What It Measures | Why Standard Stats Miss It |
|---|---|---|
| xG (Expected Goals) | Quality of scoring chances (sum of shot probabilities) | League tables count actual goals, not chance quality or luck. |
| xGA (Expected Goals Against) | Chances allowed to opponents (defensive shot quality) | Few reports track shot quality in defense – only goals conceded. |
| PPDA (Press Intensity) | Opponent passes allowed per tackle/interception (low = high press) | Not in standings – requires play-by-play data on pressing. |
| Progressive Passes | Number of forward-moving completed passes toward goal | Traditional stats show pass counts, not their impact on attack. |
| Possession Under Pressure | Percentage of possession kept when pressed by opponents | Simple possession % ignores when/how a team holds the ball. |
How Odds Reveal What Ratings Hide
Betting markets provide another useful source of information because odds reflect collective opinion. Public money flows toward clubs with large fan bases, famous players, and strong media exposure. As more people back the same side, bookmakers adjust prices accordingly. The final odds often reveal as much about public sentiment as they do about football quality. An overrated team frequently appears with compressed odds. The market expects strong results, which reduces potential returns for bettors. An underrated team tends to receive longer prices despite producing encouraging underlying numbers. When statistical indicators and market expectations point in different directions, opportunities emerge for deeper analysis.Many experienced bettors compare xG trends, defensive metrics, and injury reports before making decisions. They often search for favorable betting opportunities where public perception appears disconnected from performance data. In these situations, a team carrying inflated odds despite strong indicators may qualify as a value bet. Some analysts also use bonus offers while testing ideas built around overlooked clubs. Readers who want to compare sportsbook conditions before placing football wagers can review GXBet promo codes at https://casinosanalyzer.com/casino-bonuses/gxbet.com. Examining terms in advance helps people understand available offers before committing real money. Odds should never replace statistical analysis, yet they remain a powerful signal. When market expectations differ substantially from performance indicators, further investigation is usually justified.
Case Studies That Challenged Conventional Rankings
Leicester City's 5000/1 odds before the 2015/16 season captured how completely every mainstream prediction had dismissed their chances. Their xG profile across the opening months pointed to a side managing chance quality on both ends of the pitch far better than their recent history suggested. Vardy and Mahrez were finishing above their expected conversion rates, and the defensive shape kept opponents to low-probability shots, holding xGA below 1.0 per match consistently. Their average shot distance conceded placed them among the more disciplined defensive units in the division before December. The underlying numbers pointed to a team earning results through process. By January, available expected-goals models placed their xG differential in the top half of the league, which made the final standings feel far less miraculous to anyone who had been tracking the figures.Morocco at the 2022 World Cup produced one of the strongest defensive performances the tournament had seen in years, backed by figures that most broadcasters overlooked until they became impossible to ignore. Their PPDA across both the group stage and knockout rounds ranked in the top three of all teams in Qatar, reflecting a pressing approach that consistently denied the opposition room to build up play. One goal conceded in the group stage and three across the entire knockout run reflected a positional discipline that held firm against Spain, Portugal, and France. Their defenders averaged 6.8 defensive actions per 90 minutes, a figure that FBref tracked consistently throughout the competition. Expected-goals models reinforced the picture, with Morocco maintaining strong defensive xG figures throughout the knockout stage. Analysts who had been following those numbers rated Morocco as genuine contenders well before the semi-final, with the data pointing that way from the opening match.
Nottingham Forest's 2022/23 season was covered almost entirely through the lens of imminent relegation. Their xGA data from the second half of the campaign directly contradicted that framing. After a difficult opening stretch, Forest cut their expected goals conceded to below 1.5 per match across the final fifteen games of the season. That defensive improvement registered clearly in the numbers before it showed up in results. They finished 16th, exactly where their second-half xGA trajectory had projected. Analysts working primarily from early-season form and media narratives had built projections that the underlying data consistently undercut from February onward.
A Checklist for Evaluating Teams More Objectively
- Compare goals scored to xG and goals conceded to xGA. A team overperforming its xG (actual goals > xG) may be stronger than it seems. Teams consistently falling short of their xG warrant closer examination.
- Analyze press and build-up stats: Look up PPDA (press intensity) and progressive passes on Understat or analytics sites. A low PPDA indicates strong pressing, while high progressive passes suggest creative buildup. These reveal style: e.g., Barcelona-like pressers or possession dominators might not shine in basic tables.
- Check possession-under-pressure: Use SofaScore’s advanced stats or Wyscout’s match reports to see the percentage of possession kept under pressure. Teams that retain the ball well under duress handle high-press systems (like Manchester City). This stat isn’t in league rankings but shows composure.
- Compare squad market value to table: On Transfermarkt, note the team’s market value versus its league rank. An underperforming team with a high market value (big stars, expensive squad) may be overrated. Conversely, a low-value squad punching above its weight could be underrated. This contextualizes “expectations vs. reality."
- Scan bookmaker odds: Check average odds on sites like OddsPortal or a bookmaker to see how the market prices the team. If odds are suspiciously short (despite middling form), public bias may be at play. Extremely long odds on a team with decent underlying stats suggest a sleeper value. Use promotional tools (e.g., GXBet promo codes) to test bets on such teams cheaply if desired.
- Balance media narrative with data: Finally, compare mainstream reports with analytics write-ups (from sources like Football-Data or team match reports). If journalists stress “bad form” but stats show little change in expected performance, trust the numbers.
FAQ
What is an overrated football team?A team considered stronger than its underlying performances suggest, often due to media attention, historical success, or public perception.
What is an underrated football team?
A team whose performances and underlying metrics are better than public opinion or betting markets indicate.
Is xG useful for evaluating teams?
Yes. Expected goals measure chance quality and often provide a more reliable indicator of future performance than goals alone.
What does PPDA mean in football?
PPDA (Passes Per Defensive Action) measures pressing intensity. Lower values indicate more aggressive pressing.