Football Heat Maps Explained: How They Reveal Tactical Insights and Player Movement
 source marca
When watching a football game, it is simple to appreciate the goals, the tackles, and the skills on display. However, every single pass and sprint has an intricate underlying narrative of movement patterning and strategy. Many people who engage in analytic recommendation services try to derive meaning from this and back it up with football strategy heat maps.
But just as the name suggests, these maps do not primarily exist to be beautiful or appealing. Football maps do have a more sophisticated purpose, supporting coaches, fans, and analysts with strategic planning, as well as visually exhibiting the essence of moves made throughout the intense football games.
In this blog, we will delve into the details of how heat maps function, the information they possess, and the enormous impact they have in understanding football.
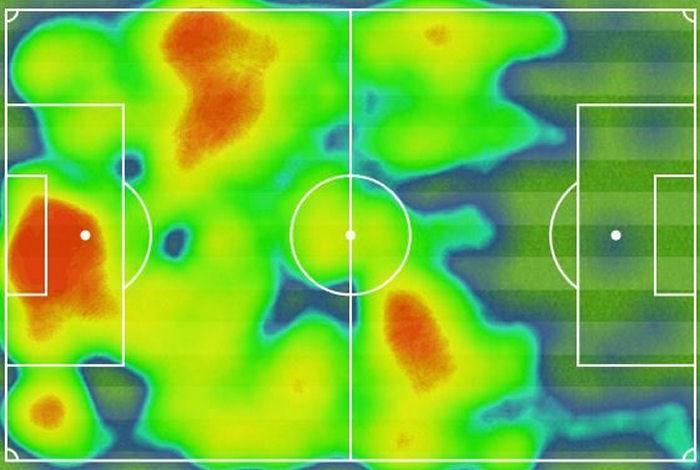
What Are Football Heat Maps?
Maps are simply the graphical representation of a certain area being showcased. Football is one of the hottest pursued sports. The maps would depict the zones that need focus, construction, as well as their coordination. In short, heat maps represent the zones that require effort in football to shape the fields to be properly strategized.
Heat maps demonstrate the factors that seem to perform the best, understanding tactics with a focus on the use of handy suggestion visualization tips and tricks, and with a slight twist on the approach to these strips.
This material is prepared by advanced mapping technology, such as GPS trackers every player wears, optical tracking cameras around the stadium, and manual or digital event recording. Data is collected, and movement, touches, and involvement across the field are displayed with pinpoint precision.
What gives heat maps unparalleled power is their capacity to depict important tactical information instantly. They demonstrate:
● Coverage: A player’s work rate and where they spend most of their energy.
● Touches and involvement: Outlining the extent of a player’s participation in different zones.
● Zones of control: Marking which regions of the pitch a team is heavily dominating or defending.
Tactical Applications of Football Heat Maps
Sport heat maps illustrate more than impressive visuals. They simplify multifaceted strategies in a match for coaches, analysts, and players. With this visualized data, coaches can easily and more accurately see how a team is structured, how they use their pressing, or spatial control.
Studying Team Shape and Pressing Patterns
Coaches often look at a heat map for team shape to evaluate how well a given team defends and attacks. A team that pressures intensely on the pitch tends to have dense red areas around their opponent’s eighteen-yard box, which is indicative of an intense pressing system. On the other hand, “hot zones” around a team's defensive third would indicate that the team sits deep. These visual cues assist managers in determining
whether their tactical directives are being followed or if changes need to be made within the game.
Spotting Overlap Zones and Structural Weaknesses
Heat maps assist in identifying areas of overlap, these may include fullbacks and wingers who work together or double up on the flanks. Coaches are always looking to sharpen their chances of scoring, so by identifying these areas, they can take advantage of the numerical superiority or potential overload. On the other hand, any area in the heat map devoid of activity may indicate structural weaknesses, for instance, a widening midfielder may leave threatening gaps in the center of the pitch, which an opposing coach would love to take advantage of.
Real Examples of Tactical Roles
Trends for certain formational shifts can often be clearly seen with the help of heat maps. For example:
● Inverted full-backs like João Cancelo playing for Manchester City tend to have heat maps featuring wide channels with lesser volume while instead showcasing greater concentration of activity within the central midfield regions.
● Imagine Lionel Messi prior to his departure from Barcelona, playing as a false nine. His heat map certainly wouldn’t show the familiar striker box areas; rather, it would illuminate the deeper playmaking regions lying between the midfield and defense.
How Fans and Analysts Use Heat Maps for Deeper Understanding
Everyone is well aware that working with data is not limited only to elite football coaches and analysts, as it has most recently become popular among fans and football content creators. The reason behind their heat map fervor is the need to think beyond the basics, and these visual depictions allow the viewer to comprehend more comprehensively, allowing them to explore emerging trends in tactical understanding of strategies, roles, or even performance metrics of players. Smarter Fantasy Football Picks
It goes without saying how fervent fantasy football enthusiasts are when it comes to drawing maps and strategically pinpointing performance hot zones. For instance, a midfielder who is regularly seen in the box and wide-positioned full-backs who receive the ball high and wide are some of the overlooked players waiting to fade into the background.
Insightful Post-Match Reviews
Fans often try to imagine what transpired on the field after the match is over. They try to figure out what the score might mean. Were there any key moments? Did a team outplay their competitor, or did they just capitalize on some opportunities? The player stats, driven by heat maps, determine the player’s activities and control during gameplay, thus giving context to why players are evaluated differently by fans.
Tactical Breakdowns by Bloggers and YouTubers
The sports sphere is being tackled by modern creators. Tutorials on YouTube and tactical blogs often showcase the role of a playmaker through heat maps, a defensive one that controls the tempo of the game, or a wing defender who pushes into the offensive part of the pitch.
Heat maps are an easy-to-comprehend resource that benefits fans and analysts alike. They provide relevant data and graphics by integrating player movement maps into previous matches on the website. The users analyze match formations, edits made during the game, and positional changes to create and assess a team’s strategy.
How Tactical Tools Like Heat Maps Help Bettors Make Smarter Decisions
As football fans become more tactically savvy, a growing number of informed bettors are turning to advanced tools like heat maps to guide their match predictions. Beyond the basics of form and head-to-head records, analyzing player movement and team structure offers deeper context that can significantly enhance decision-making.
As the sport is becoming more and more popular around the globe, there are far more people engaging in betting activities, which creates the need for better and more sophisticated techniques to place bets. Properly identifying available resources (like advanced tools such as Heat Maps) ensures winning headlines, especially when coupled with analytical technology that goes deeper than the usual assessment of form or past meetings between a player.
A good example of such visual tools is heat maps. Such maps provided much valuable information when it comes to eyeing back strikers or defenders, as well as goal involvement precision. Surely, these maps can accurately predict the level of assists, possible goals, and overall team attack potential as long as information on forwards and attackers' roles, such as wide striker or fullback, who tend to get involved, is compiled.
The same applies to the identification of central compact midfield zones and wide overloads, as these areas may define certain outcomes, such as overall possession figures of goals scored in a match.
A modern blend of tactical insights and betting information is now available through data-powered analysis. For patrons who pair tactics with pre-match research, 7bet offers football betting options with stats, game insights, and team previews. It enables patrons who seek more than vague predictions to apply an analytical approach to anticipate and view upcoming matches.
As tactical understanding evolves, how fans engage with the sport, an increasing number of users interacting with match data and visualization tools need heat maps to make accurate football predictions.
The Future of Football Analytics and Visual Tools
The gameplay analysis provided by modern technology has now become available to each football follower, as no longer reserved for in-depth scrutiny. This fan's interaction with the data marks the beginning of a new era. This emerging fan culture is actively changing the overall experience for the supporters. Fans can now access sophisticated tools that allow them to professionally analyze trends in sports data and player
performances.
Visual analytics is driving this change. In addition to heat maps, fans can use:
● Pass maps that show the relationships and interactions between players in terms of passing
● xT (Expected Threat) charts that show how given actions of a particular player may affect the probability of scoring a goal.
● Progressive carry maps for a specific player show the player advancing the ball to the area of defenders he is eluding.
These visual analyses are capable of advanced representations of large sets of numbers. Any person interested in football can now analyze raw digits into numbers and complex tactical ideas accessible for understanding.
Fans have always cheered for their favorite teams or players, but now they no longer passively stare at screens; they are transforming into semi-adept strategists. These spectators can analyze and discuss pressing systems, pinpoint overloads, and even inversely rotate and fluidly possess the ball at a level that would rival a coach. This depth of understanding tactics is closing the gap between observers and the fans in the stands and walking professionals on the side of the field, or the touchline.
Final Thoughts: From Broadcast to Breakdown – How Heat Maps Enhance the Fan Experience
Now, watching football is only half of the experience. Following the broadcast of a game while watching the scoreboard is engaging, but it only scratches the surface of the contemporary game. The existence of tools, for example, heat maps, permits the fans to watch much more than just a tape. The virtual representation of a player's movements, accompanied by the commentary, allows the fans to access the mind of a strategist.
This spans from observing the extent of a midfielder’s influence in a match to determining a full-back’s positional advance into attacking areas of the pitch. Heat maps enhance broad tactical imagination and even detail-oriented activities.
Football enthusiasts are treated to modern-day conveniences that are always ahead in innovation, with technology that builds upon their experience with each passing day. Both the game and its viewers are undergoing a transformation from dormant spectators to active participants engrossed in an intense strategic and analytical shift.
Recently added
- The Deepest Squads at the 2026 World Cup
- What Makes the 2026 Champions League Final Different
- How Starting Lineups Can Dictate a Match
- Michael Carrick Closes In On Unique Manchester United Record… and the Full Time Manager’s Job?
- Fasten Your Seatbelt for Another Thrilling English Championship Title Race
Heat maps assist in identifying areas of overlap, these may include fullbacks and wingers who work together or double up on the flanks. Coaches are always looking to sharpen their chances of scoring, so by identifying these areas, they can take advantage of the numerical superiority or potential overload. On the other hand, any area in the heat map devoid of activity may indicate structural weaknesses, for instance, a widening midfielder may leave threatening gaps in the center of the pitch, which an opposing coach would love to take advantage of.